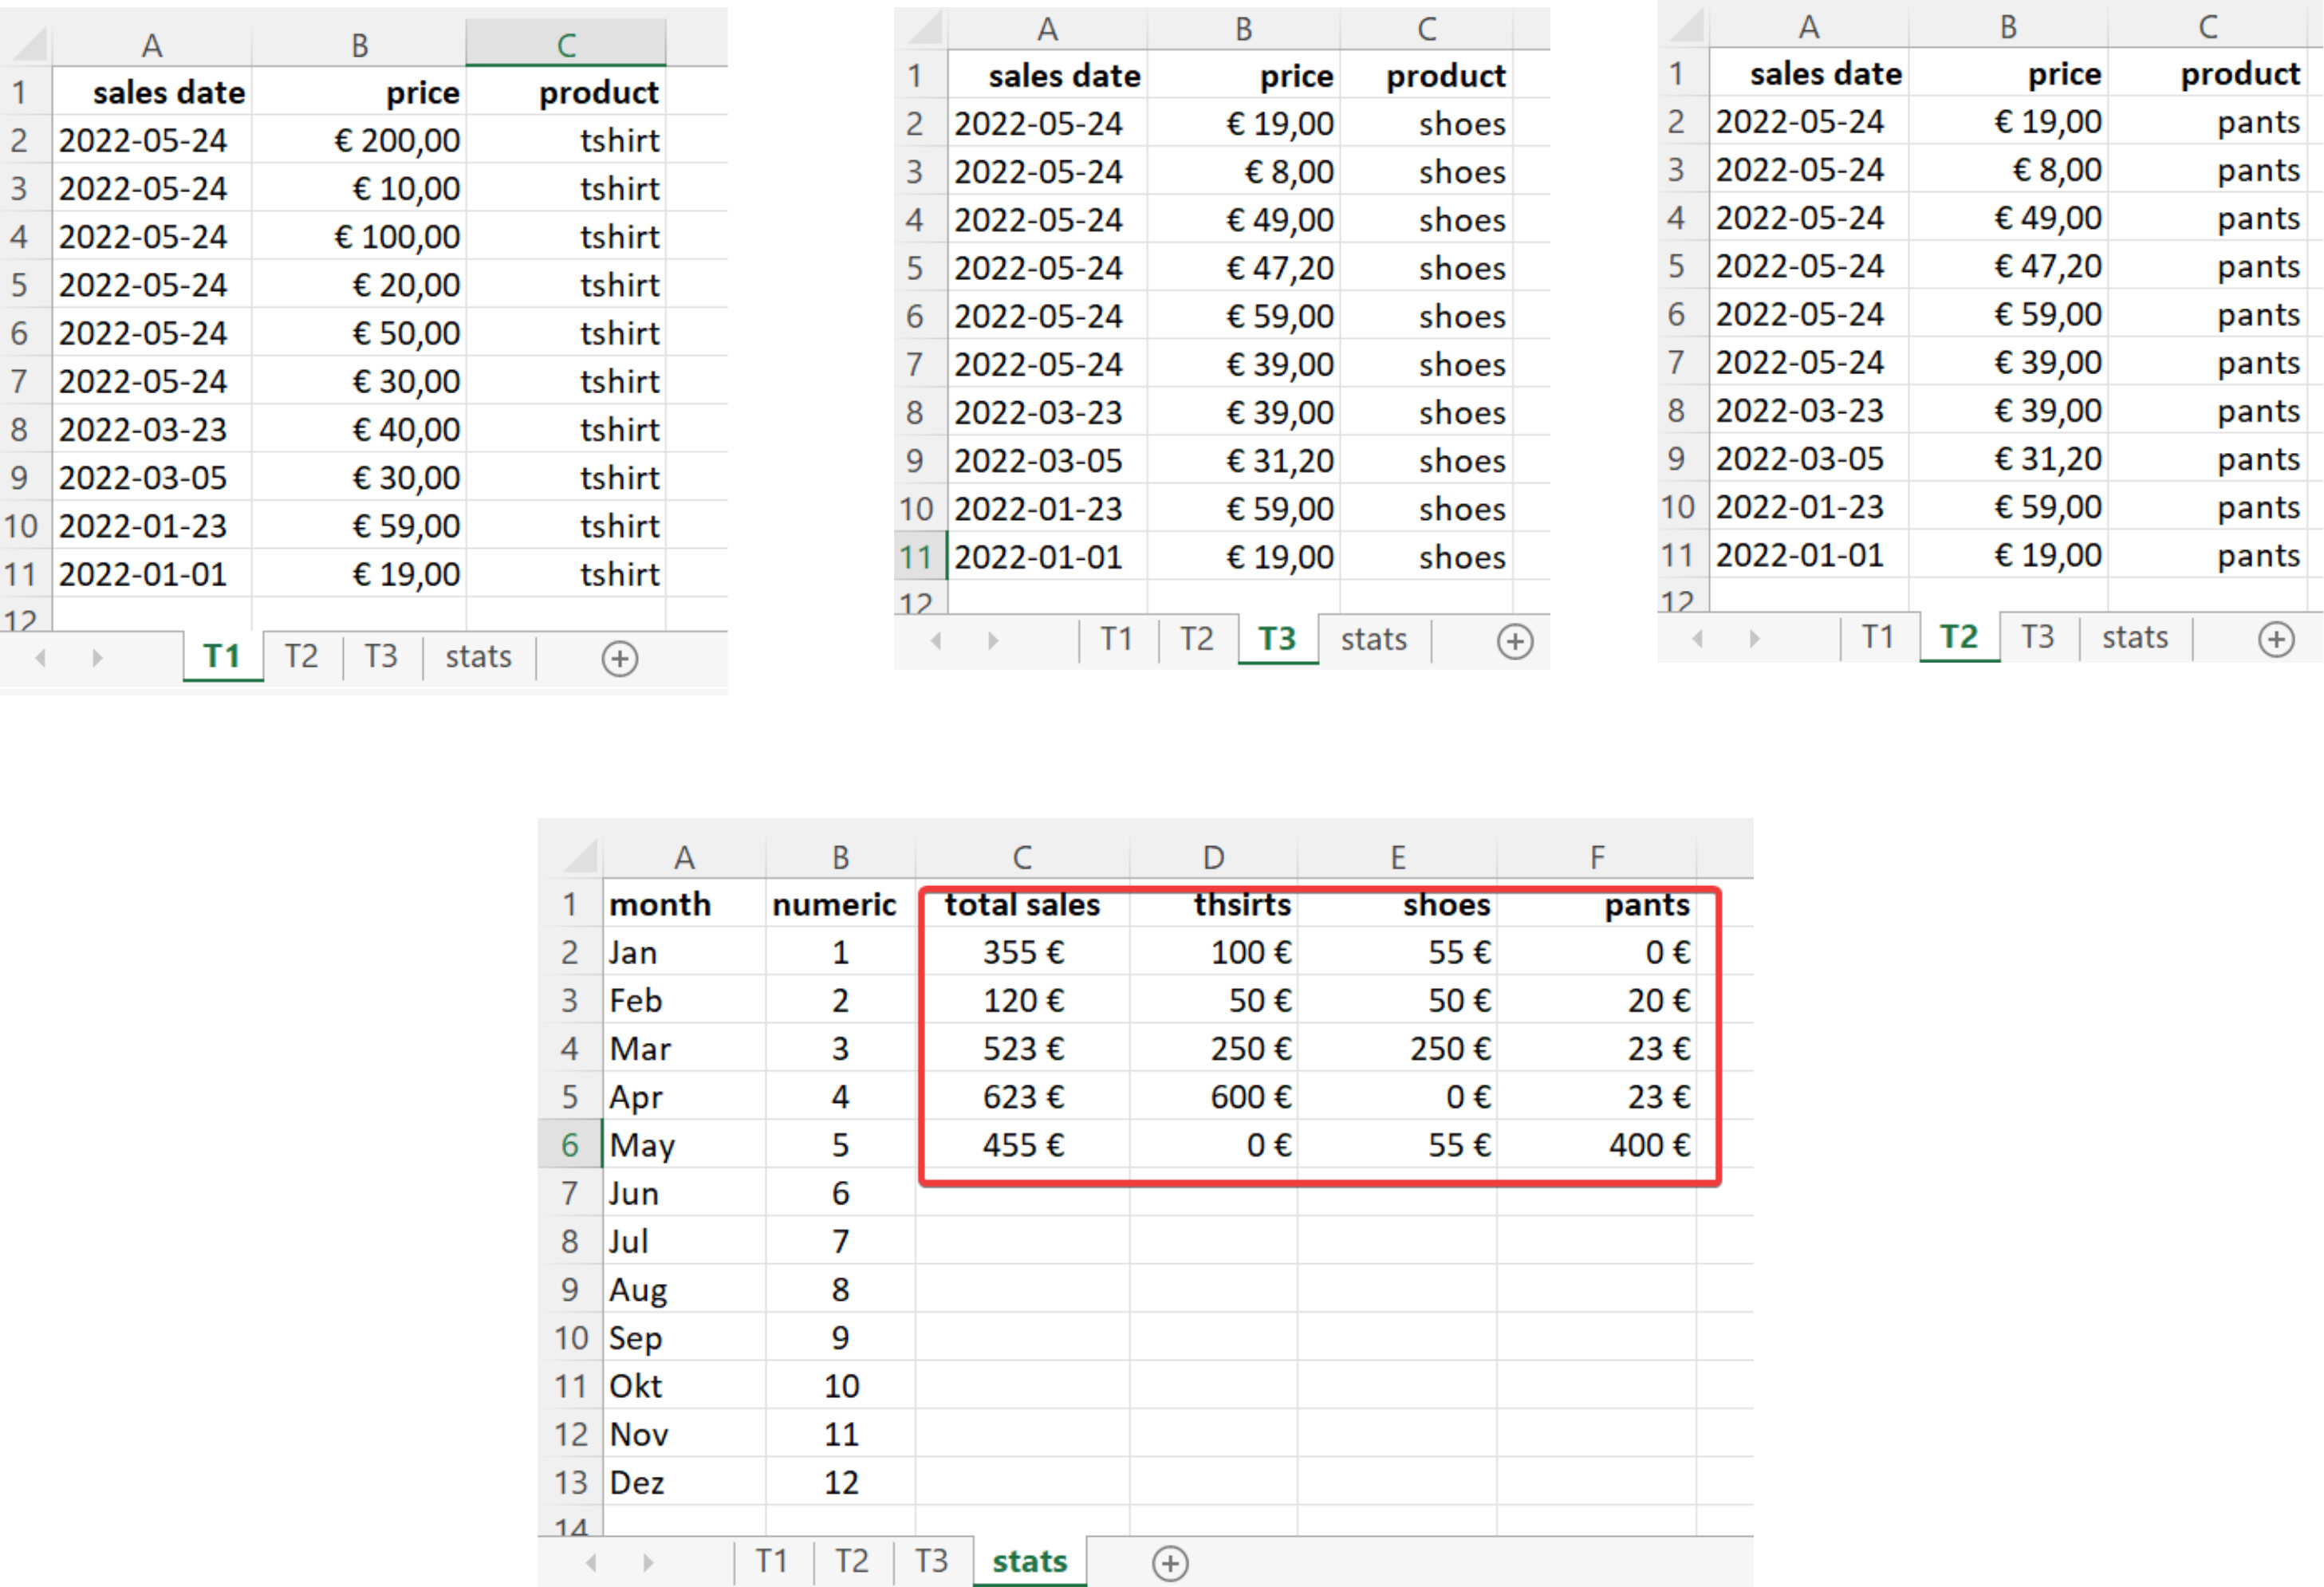
I’ve got three tables T1, T2 and T3. Each table contains the sales date e.g. 2021-05-03 and the price e.g. € 20.00. I created another sheet named “stats”. In this sheet I want to sum up all sales for each month as shown in the picture.
Can someone give me a tip, how to archive that easily
I guess that might be a question that many people have.
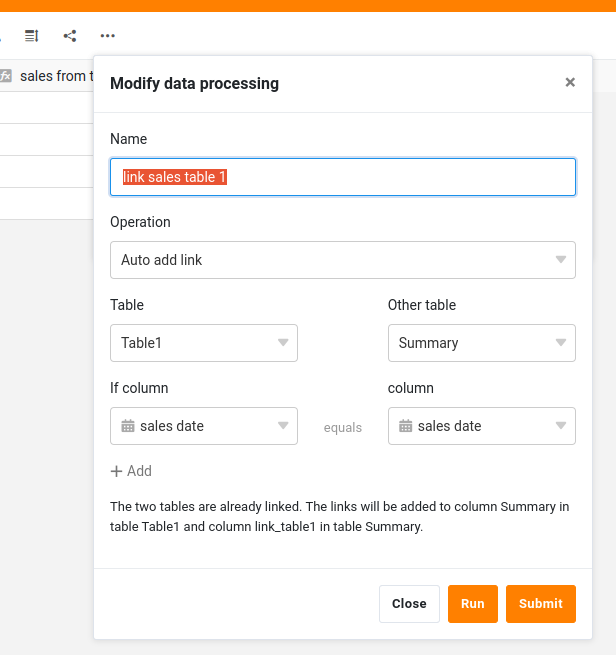
Now you could manually select in the link to other records column all the entries. But this is unproductive work and faulty. Instead use “data processing” and create this data processing procedure. Every time you run this all columns are linked up and you get the sum of all prices OF ONE DAY.
now you can do many things to make this even better.
you could add a button and assign this data processing to it. This makes it easier to execute this. In the near future it will be possible to create an automation to do this automatically.
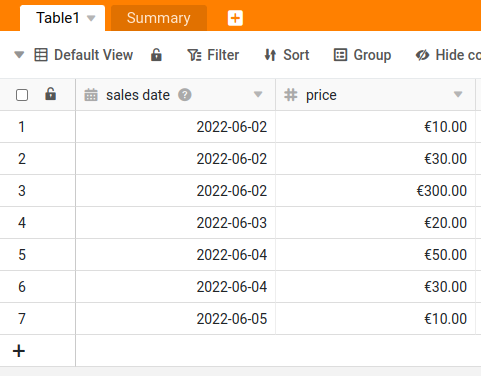
add more tables to add more sales
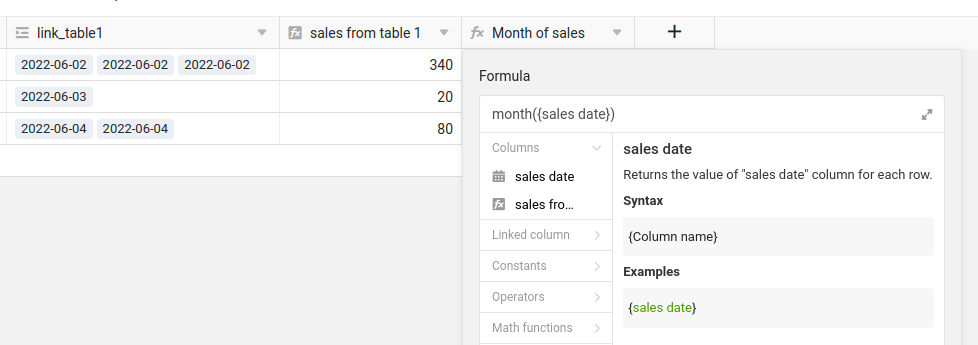
hide columns that you don’t need. E.g. on the table1 you could hide the new linked column. You don’t need this to see.
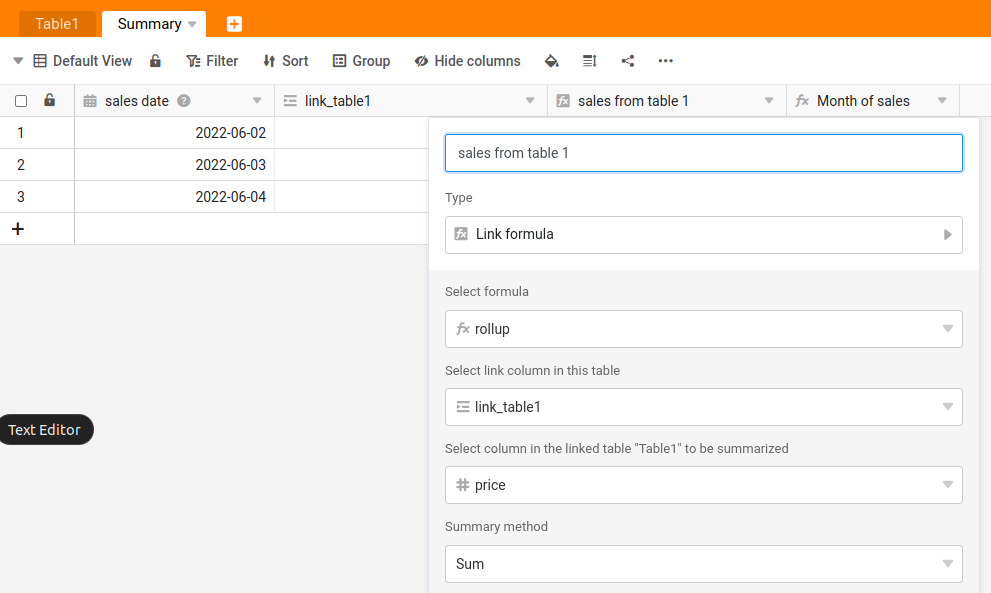
to get the sales of a month use a formular column and let you show the month of the date