Good afternoon! I like the “Advanced statistical” plugin, however, I can’t reverse the display order. I want the value to be blue first (“Completed”), then green (“In progress”) and then gray (“Scheduled”).
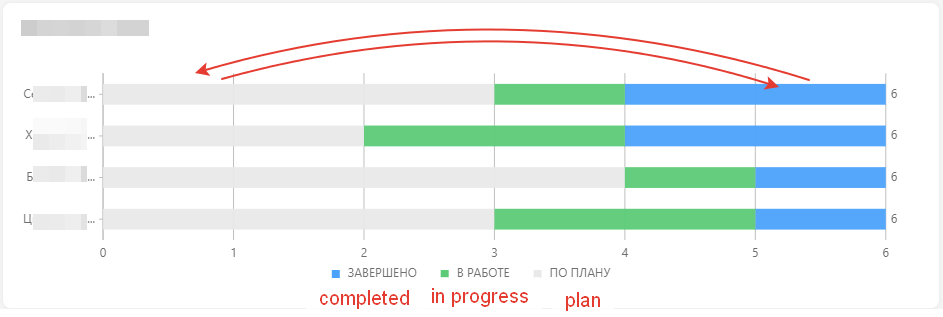
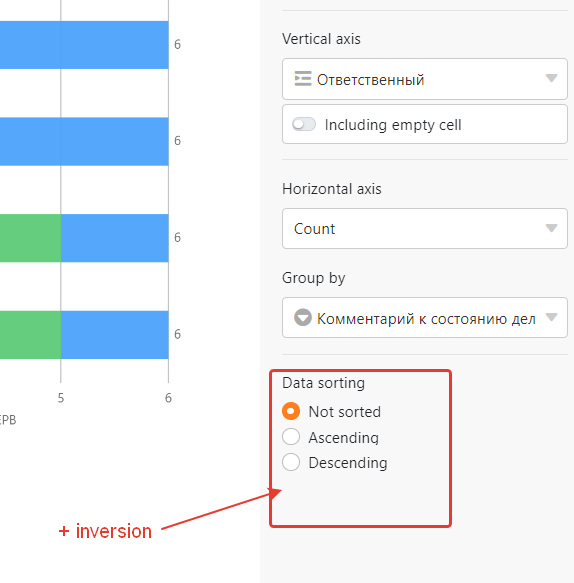
No matter how hard I try, I can’t put what is completed on the left side of the graph. In my case, when setting up sorting, only gray and green colors change. The blue (“Completed”) remains always on the right side. Please tell me if there is any logic in the ordering of this graph.
PS: I tried swapping the values of a single selection - it doesn’t help. It seems to me it would be logical to adjust the sorting in the charts depending on the position of a “single selection”. Or, it would be possible to change the location when dragging the description of the color value at the bottom of the graph. What do you think?