Before we moved to Seatable, we were actively using Google Data Studio to build dashboards to visualize data from Google Sheets. But now I can’t find a service that is integrated with Seatable. Could you please advise me on a service that I haven’t found or another solution? Thanks/
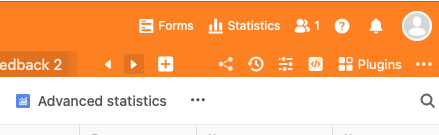
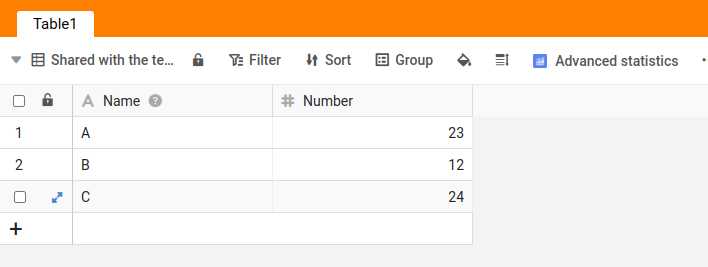
SeaTable has an area called “Statistics” but also a much better plugin you can install called “advanced statistics”. I don’t know if this is dependent on which version of ST you have (I have the Enterprise version). See screenshot.
1 Like
How do I set the date range? Mine displays data for the entire time. As I understood it, I need to create a separate view and create filters by date there. But then how to restrict access to this view to the team if you do not make the view private (because for private views there is no such view in the list)
You can control the view and advanced statistical chart permissions by customizing the sharing permissions. This function is a paid version.
Where can I specify find these settings? I’m an enterprise member.
Let me try to explain this:
Image you have a base with some secret values:
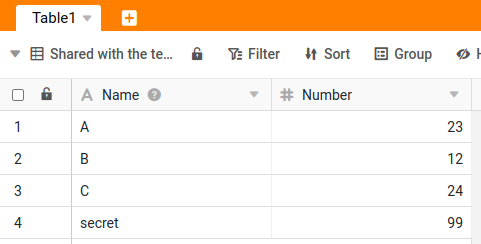
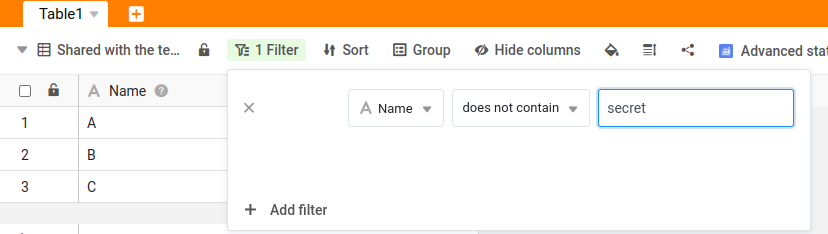
You can create a view and define a filter.
Now you can create a custom sharing permission on the first page of seatable
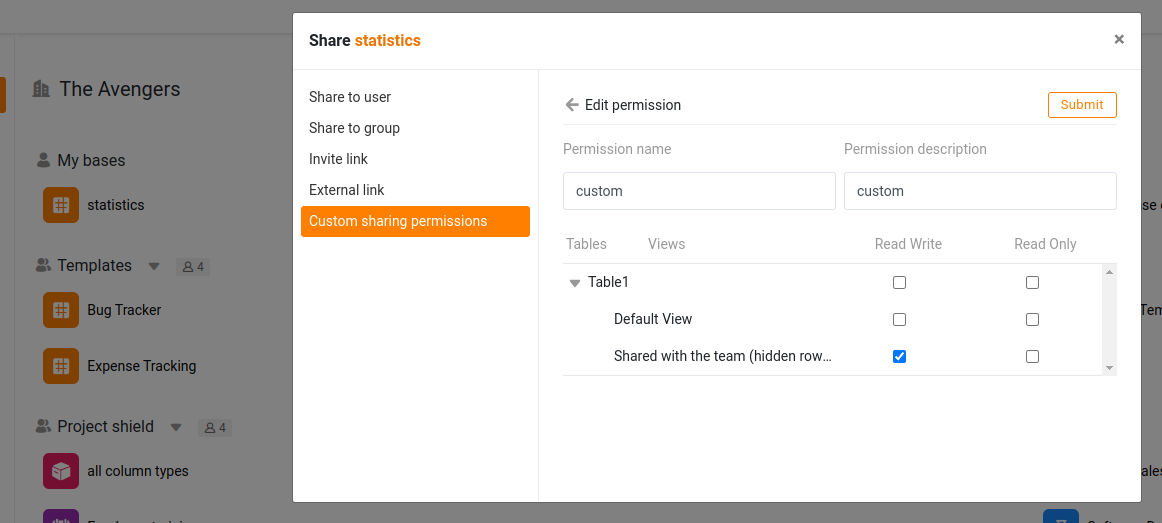
and share this custom permission to a group.
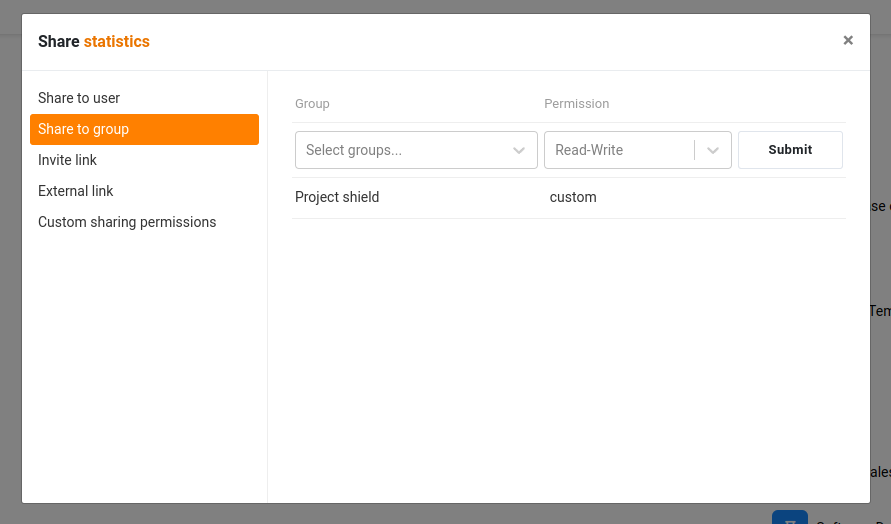
Any member of this group can now only see the values that are part of this view and the statistics will only show these values

this is how it looks for a team member: there is no filter but the secret value is not visible.
Important: this custom sharing permission is only available for Plus or Enterprise Customers.
1 Like
This topic was automatically closed 90 days after the last reply. New replies are no longer allowed.